At SNAP Biolabs, we provide customized flow cytometry solutions and are looking forward to working with you to achieve your goals.
Basic Statistical Analysis: Flow Cytometry
Typically described using frequencies and fluorescence intensity in one- or two-dimensional gating steps.
SNAP Biolabs offers the following basic statistical analysis for flow cytometry:

- Frequency analysis (evaluate changes in « % positive » events in the target population)
- MFI analysis (assess levels of changes in the target protein expression)

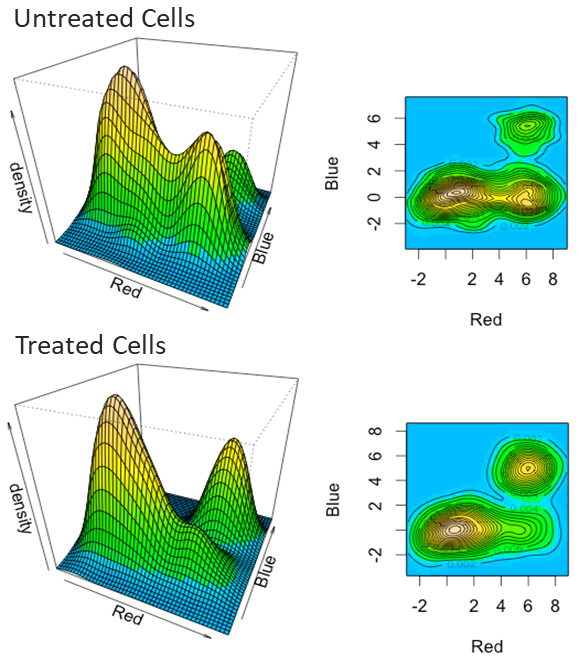
- Proliferation analysis (the best statistical method to compare growth curves for treated and untreated cells, e.g. multiple comparisons test, post-hoc tests, planned comparisons test, orthogonal comparisons)
- Cell Cycle analysis (cell DNA content data normalization and gating, estimation of the proportion of cell populations in different phases of the cell cycle)
Advanced Statistical Analysis: Flow Cytometry
Typically used for high-dimensional data visualization and comparison of the phenotypes of cell clusters.
SNAP Biolabs offers the following advanced statistical analysis for flow cytometry:
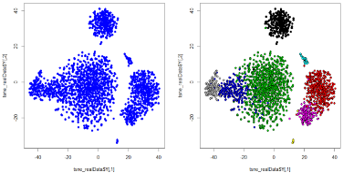
- t-SNE analysis (unsupervised, non-linear dimensionality reduction technique suitable for visualizing high dimensional datasets in two-dimensional space)
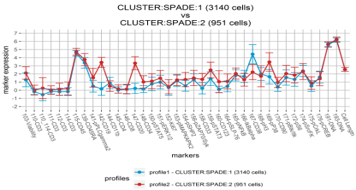
- CytoCompare analysis (provides a multivariate distance measure as well as a p-value asserting the statistical significance of the phenotypical difference)
Typically used for high-dimensional data to differentiate hierarchical cell clusters associated with a specific phenotype.
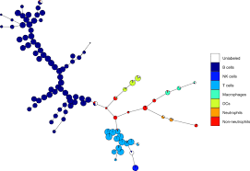
- SPADE analysis (unsupervised, non-linear dimensionality reduction technique will cluster cells in many groups and visualize the results in a minimal spanning tree)
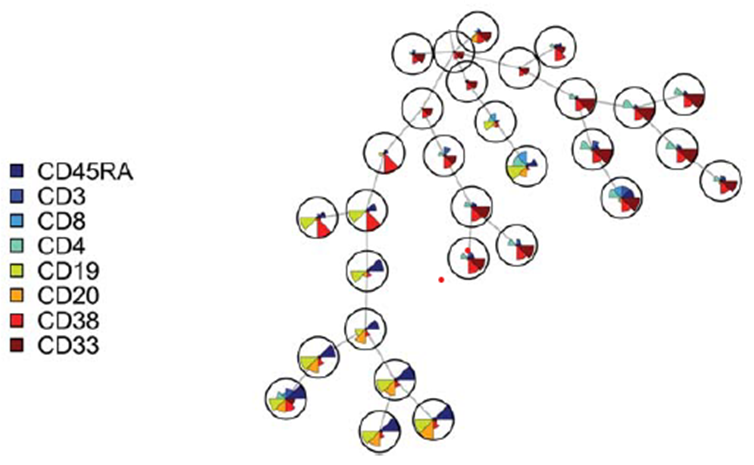
- FlowSOM analysis (similar to SPADE technique in which a discretized representation of the input space is trained and offers additional plotting and meta-clustering calculation)
- Citrus analysis (supervised populations finding whose abundance differs between healthy and diseased patients, treated and untreated cells)
Typically used for high-dimensional data to uncover multidimensional relationships.
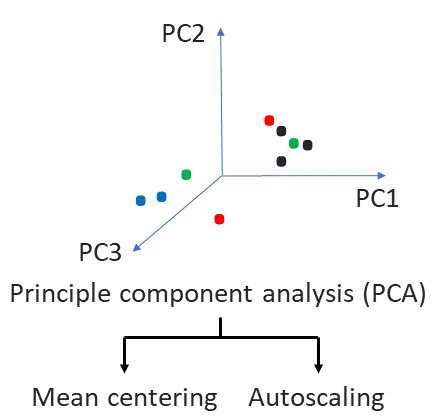
- Principal Component Analysis (PCA) unsupervised, non-linear dimensionality reduction technique to study the most prominent variation in (co)-expression of all markers across all cells exhibited by specific phenotype.

Machine Learning Algorithms:
- Develop predictive models that can accurately predict the outcome of experiments or treatments.
- Classify cells and better understand the composition of a sample (e.g. to identify rare cell types or to identify cells that are associated with a particular disease or condition).
- Evaluate correlations between flow cytometry data and other data sources (e.g. gene expression data) to understand biology of a system and how it is affected by different treatments or interventions.